|
40.0°F

Cold
Feels like:
40°F
24-hr difference
-5.4°F |
| |
Today |
Yesterday |
| High: |
41.4°F
12:00am |
53.7°F
4:52pm |
| Low: |
40.0°F
1:07am |
41.4°F
11:57pm |
| High & Low March 2025 |
| High: |
75.1°F |
| 11 March at 4:27 PM |
| Low: |
20.2°F |
| 03 March at 6:50 AM |
| Max Min: |
52.2°F |
| 05 March |
| Min Max: |
41.1°F |
| 02 March |
| High and Low 2025 |
| High: |
75.1°F |
| 11 March at 4:27 PM |
| Low: |
7.4°F |
| 23 January at 6:32 AM |
| Max Min: |
52.2°F |
| 05 March |
| Min Max: |
22.4°F |
| 21 January |
| Record March |
| High: |
88.0°F |
| at 04:54 on 28 March 2017 |
| Low: |
5.0°F |
| at 23:58 on 03 March 2014 |
| Max Min: |
61.5°F |
| at 06:31 on 10 March 2016 |
| Min Max: |
31.8°F |
| at 13:45 on 06 March 2015 |
| Station All Time Record |
| High: |
101.9°F |
| at 15:51 on 02 August 2024 |
| Low: |
1.0°F |
| at 07:23 on 23 January 2014 |
| Max Min: |
78.1°F |
| at 06:58 on 23 June 2024 |
| Min Max: |
16.7°F |
| at 12:04 on 16 February 2015 |
| Records began on 24 December 2012 |
|
|
| Now: |
40.0°F |
| Coldest Wind Chill |
| Today: |
40.0°F |
| at 1:07am |
| Yesterday: |
41.4°F |
| at 11:57pm |
| March 2025 |
8.2°F |
| 02 March at 5:37 AM |
| 2025 |
-3.6°F |
| 22 January at 6:58 AM |
| Station March |
3.4°F |
| at 01:56 on 06 March 2015 |
| Station All Time |
°F |
|
| Records began on 24 December 2012 |
|
|
| Heating Degree Days |
| Today: |
1.2 Degree Days |
| Yesterday: |
19.0 Degree Days |
| Cooling Degree Days |
| Today: |
0.0 Degree Days |
| Yesterday: |
0.0 Degree Days |
|
|
| Now: |
40.0°F |
| Warmest Heat Index |
| Today: |
41.4°F |
| at 00:00 |
| Yesterday: |
53.7°F |
| at 16:52 |
| March 2025 |
75.1°F |
| 11 March at 4:27 PM |
| 2025 |
75.1°F |
| 11 March at 4:27 PM |
| Station Record March |
95.6°F |
| at 04:54 on 28 March 2017 |
| Station All Time |
122.8°F |
| at 14:48 on 16 July 2024 |
| Records began on 24 December 2012 |
|
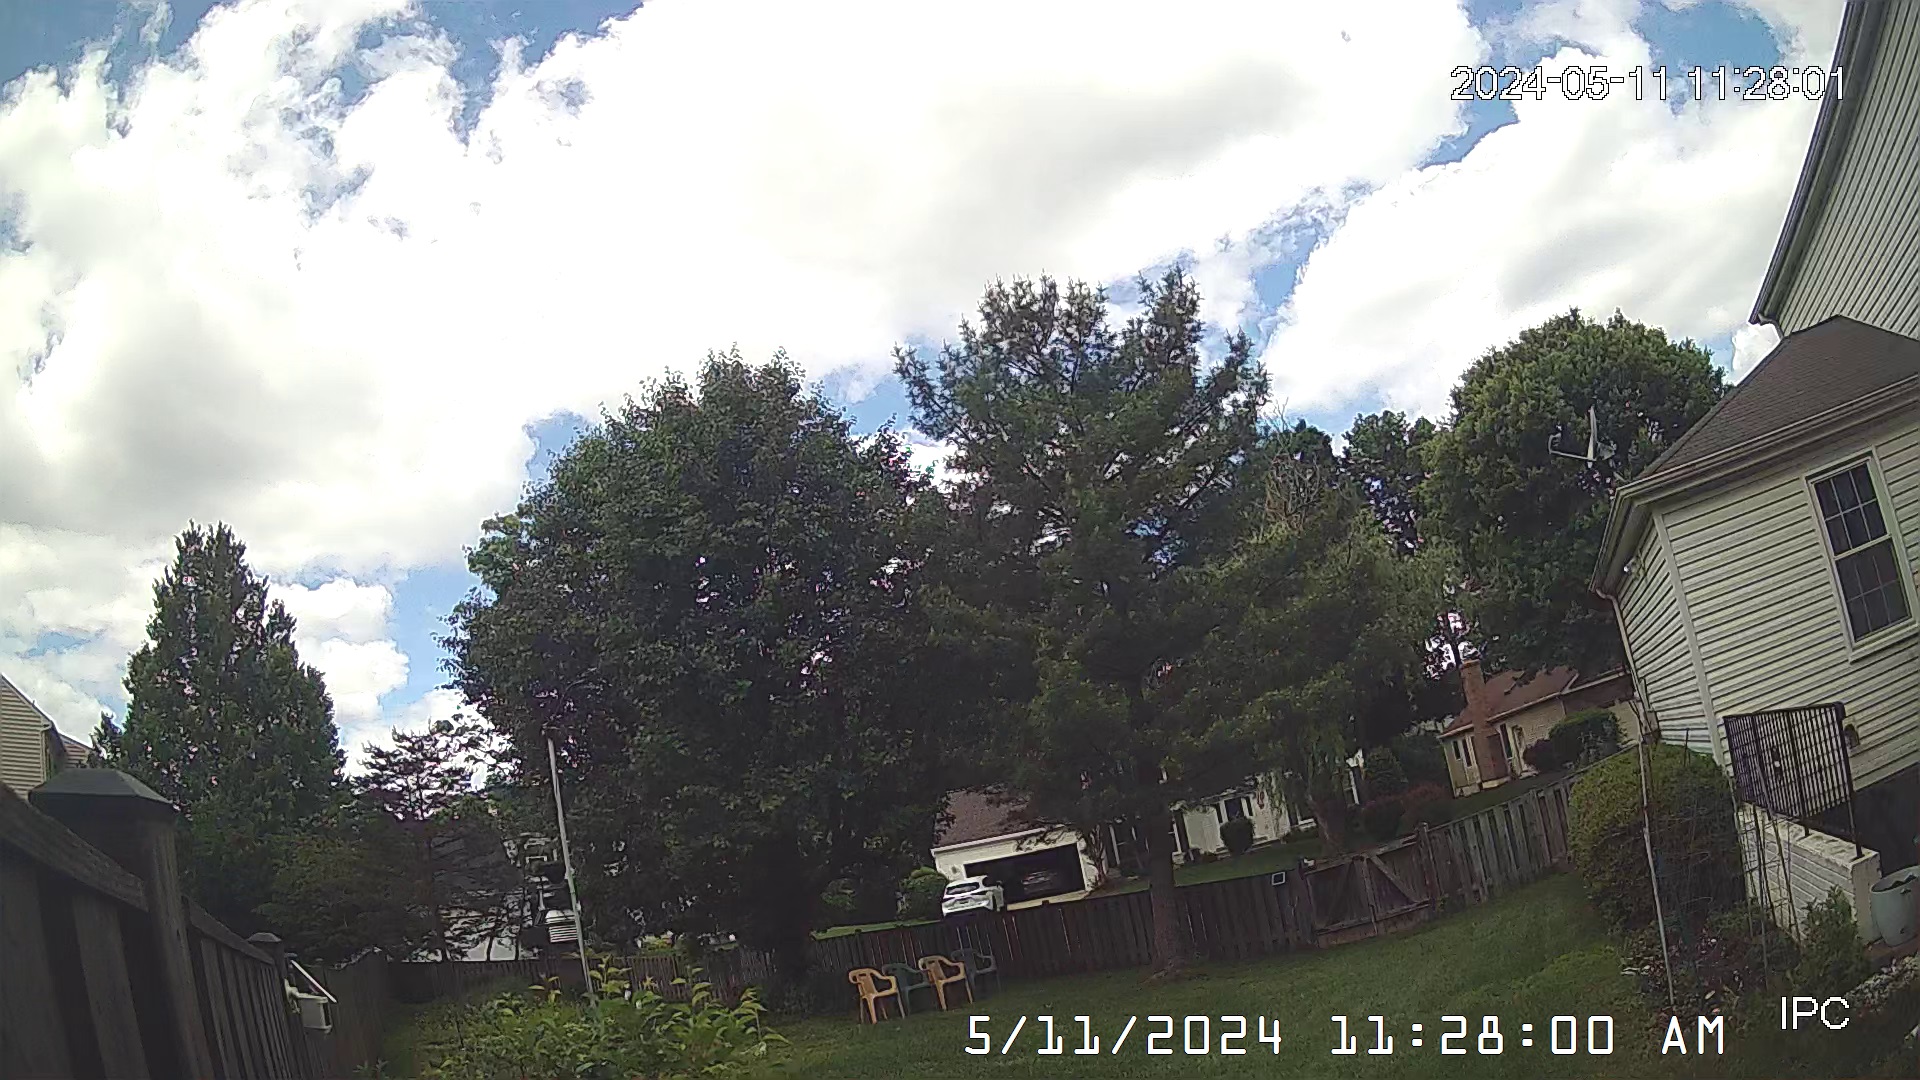
| WeatherCam Thumbnail |
|
North North West Camera
|
|
|
|

|
Clear
|


|
SSE
0
Gust:
1 mph
|
|
0 Bft -
Calm
|
|
Today:
2 mph
12:31am
|
|
Gust Month: 27 mph
March 1
|
| Rain Today: |
0.00 in |
| Rain Rate /hr |
0.00 in |
| Rain Last Hour: |
0.00 in |
| Rain 24hrs: |
0.00 in |
|
| Wind |
| Station High March 2025 |
| High Gust: |
27 mph |
| 01 March at 2:22 PM |
| High Average: |
8 mph |
| 01 March at 7:36 PM |
| Station High 2025 |
| High Gust: |
27 mph |
| 01 March at 2:22 PM |
| High Average: |
8 mph |
| 01 March at 7:36 PM |
| Station Record March |
| High Gust: |
39 mph |
| at 03:20 on 02 March 2018 |
| High Average: |
24 mph |
| at 13:07 on 02 March 2018 |
| Station All Time Record |
| High Gust: |
42 mph |
| at 12:56 on 04 January 2018 |
| High Average: |
24 mph |
| at 13:07 on 02 March 2018 |
| Records began on 24 December 2012 |
|
| Wind Run |
| Today: |
0.1 miles |
| Yesterday: |
11.4 miles |
| Highest Wind Run |
| March 2025 |
74.3 miles |
| 01 March |
| 2025 |
74.3 miles |
| 01 March |
| March |
284.2 miles |
| on 02 March 2018 |
| Station All Time |
284.2 miles |
| on 02 March 2018 |
| Records began on 24 December 2012 |
|
| Rain Today: |
0.00 in
|
| Rain Rate (/hr): |
0.00 in
|
| Rain Yesterday: |
0.00 in
|
| This Month: |
0.60 in
|
| Season Total: |
4.30 in
|
|
7 days since last rain. |
| Days Since Last Dry Day: |
0 |
| Station High March 2025 |
| High Day: |
0.58 in |
| 05 March |
| High Hour: |
0.33 in |
| 05 March at 1:09 PM |
| High Rain Rate /hr: |
4.09 in |
| 05 March at 12:41 PM |
| Station High 2025 |
| High Day: |
0.85 in |
| 06 February |
| High Hour: |
0.33 in |
| 05 March at 1:09 PM |
| High Rain Rate /hr: |
4.09 in |
| 05 March at 12:41 PM |
| Station Record March |
| High Day: |
1.95 in |
| on 21 March 2019 |
| High Hour: |
1.98 in |
| at 16:12 on 20 March 2015 |
| High Rain Rate /hr: |
4.09 in |
| at 12:41 on 05 March 2025 |
| Station All Time Record |
| High Day: |
5.17 in |
| on 21 July 2018 |
| High Hour: |
2.21 in |
| at 16:13 on 22 July 2020 |
| High Rain Rate /hr: |
64.00 in |
| at 10:49 on 19 October 2021 |
| High Month: |
10.27 in |
| July 2018 |
| Records began on 24 December 2012 |
|
| WeatherCam Thumbnail |
|
South South West Camera
|
|
|
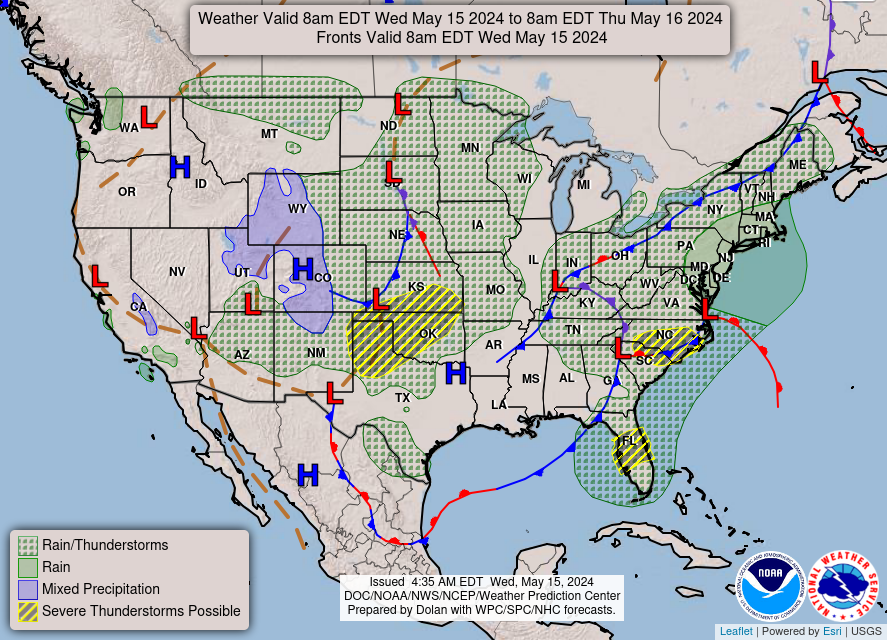
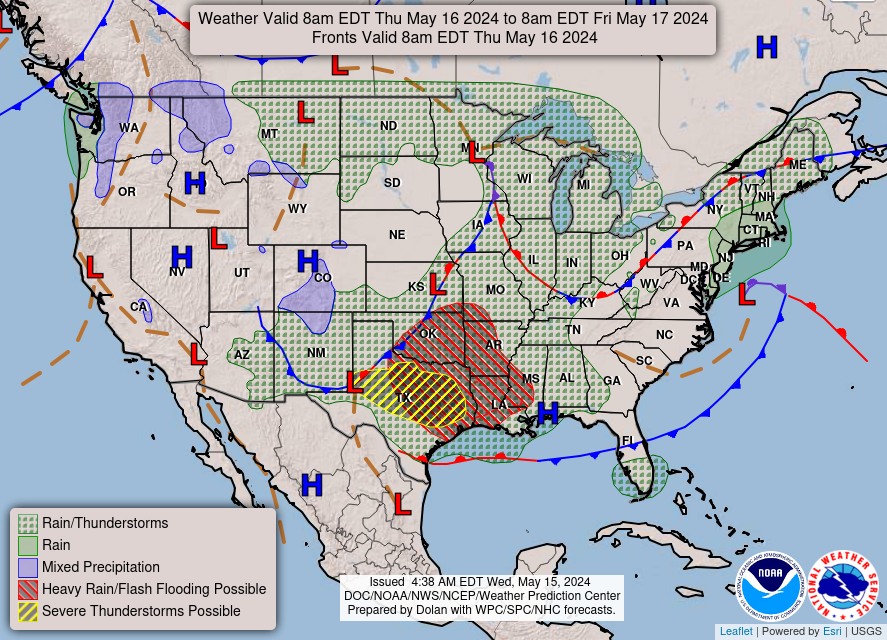
| Radar Washington DC Metro Area |
| Storm Prediction Center Activity Chart |
| Humidity: |
88 %
 |
| Dew Point: |
36.7°F
|
| Barometer: |
30.08 inHg
|
| Baro Trend: |
Rising slowly
|
| Today |
| Pressure High: |
30.09 in |
| Pressure Low: |
29.99 in |
| Dewpoint High: |
33.1 °F |
| Dewpoint Low: |
19.6 °F |
| Humidity High: |
80% |
| Humidity Low: |
40% |
| Station Record |
| Pressure High: |
31.41 in |
| at 12:14 on 23 March 2017 |
| Pressure Low: |
28.99 in |
| at 07:41 on 07 February 2020 |
| Dewpoint High: |
82.7 °F |
| at 11:55 on 05 July 2024 |
| Dewpoint Low: |
-27.0 °F |
| at 01:57 on 20 February 2015 |
| Records began on 24 December 2012 |
|
|
| Snow Depth: |
0.0 in |
| Snowfall Today: |
No Snow Today |
| Storm Total: |
0.0 in |
|
Total Season Snow: 15.5 in |
|
Total Last Season: 10.0 in |
|
|
|
|
| Sunrise: |
7:20am |
| Sunset: |
7:17pm |
| Moonset: |
7:31am |
| Moonrise: |
7:52pm |
| Day Length: |
11:54 |
| Dawn: |
06:55 |
| Dusk: |
19:43 |
| Daylight Length: |
12:47 |
| There will be 2min 33s more daylight tomorrow |
|
|
|
| UV Index |
0.0
None
|
|
High: 0.0 @ 12:00am
|
|
11 hrs 56 min 57 sec
of Sunlight Today
Which is
2 min 33 sec Longer
Than Yesterday
(Noon)
 (Midnight)
Legend
|
|
Full Moon |

|
100% %
Illuminated |
|
|
|